This barometer is based on data from the French market, where we support 1,180 events every year in their cashless deployment. While the results are expressed in euros, the trends observed go beyond this specific context and provide valuable insights for organisers, regardless of their market.
Based on aggregated and anonymised data from 25 major French festivals (ranging from 15,000 to 300,000 attendees), representative of the main regions and musical genres, several key developments emerge between 2024 and 2025. Festival-goers are spending more, more frequently and across a wider range of products. The bar remains the economic heart of the festival but consumption habits are evolving; upscaling the offer, the rise of alcohol-free options and redesigned formats are shaping a new consumption landscape.
The purpose of this barometer is to highlight consumption trends and how they change year on year, what is growing, what is slowing down and what is evolving. Above all, it provides a benchmark against the industry average, helping organisers identify optimisation opportunities to increase average spend.
That said, the analysis should be read with an understanding of a changing scope. Some festivals have adapted their offer (the introduction of spirits, new beer formats, changes to operating hours), however audience profiles, line-ups and even weather conditions can directly influence the trends observed.
Would you like to share the barometer results?
Summary
1. Overview: rising spend
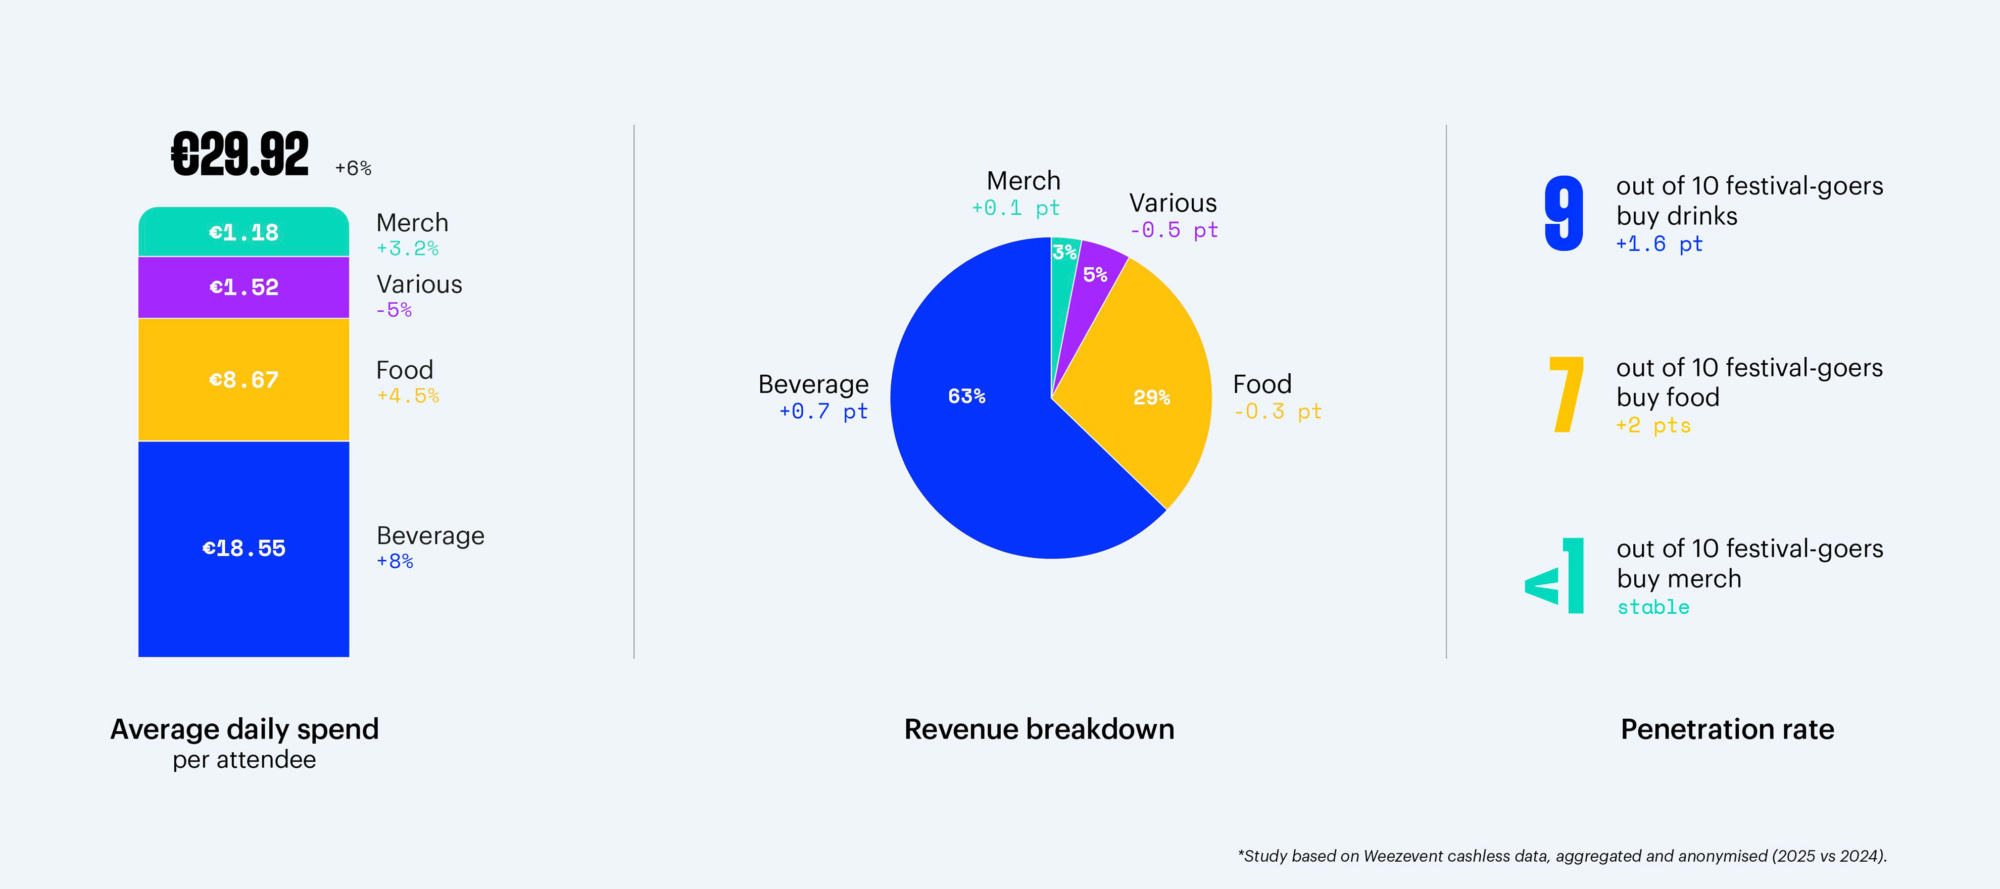
In 2025, the average festival-goer spent €29.92 per day, excluding the price of their ticket.
Average daily spend per festival-goer is up 6% compared to 2024. This increase is driven by all categories: drinks (+8%), food (+4.5%) and merchandise (+3.2%).
Overall, 9 out of 10 festival-goers buy drinks (91%, +1.6 pts), while 7 out of 10 purchase food (74%, +2 pts). Merchandise remains a niche category, with fewer than 1 in 10 festival-goers making a purchase (7%, stable).
Drinks remain the leading source of revenue for festivals (63%, +0.7 pts), followed by food (29%, -0.3 pts). Other product categories remain marginal and stable: merchandise (3%), cashless fees (2%), and other items (3%, such as attractions or activities).
All in all, festival-goers are spending more than in 2024, within a model still largely driven by bar and food sales.
2. Inside the bar: diversification and premiumisation
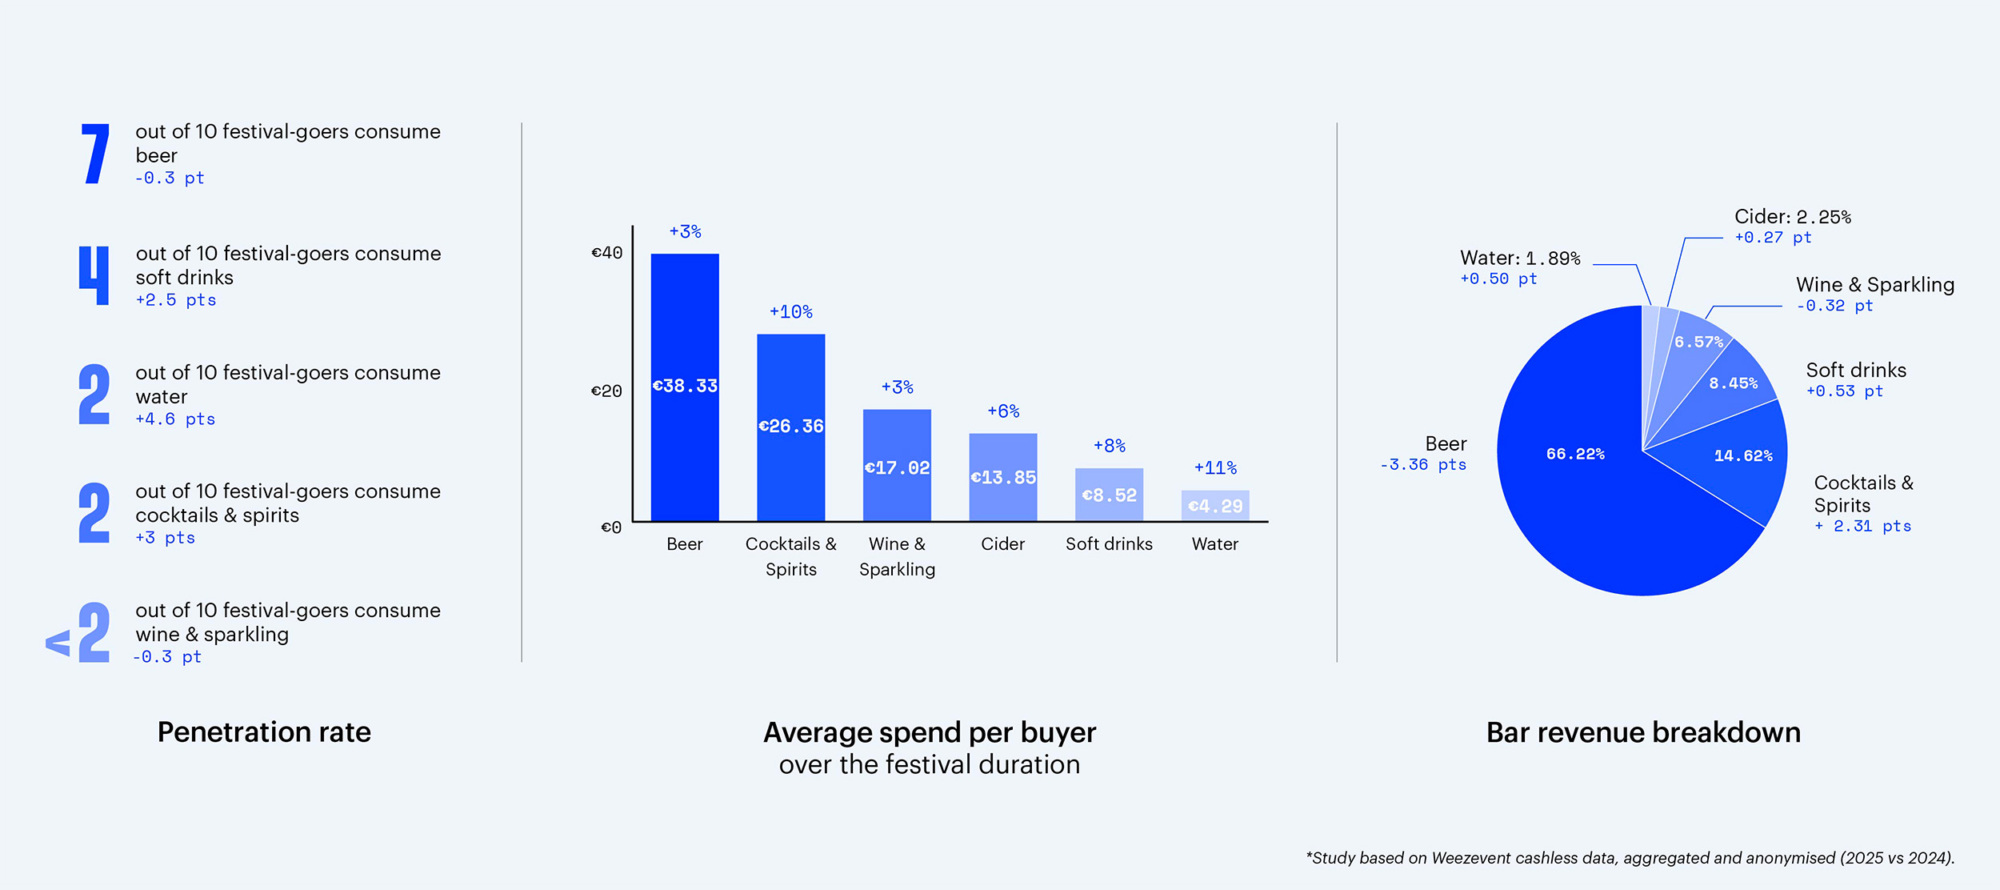
Beer remains the undisputed staple of festivals. It accounts for 6 out of 10 drinks, appeals to 7 out of 10 festival-goers and generates 66% of bar revenue alone.
However, it is losing some ground. Fewer orders now include beer (-2.7 pts) and its share of bar revenue is declining (-3.36 pts), a mechanical effect of the broader range now offered at the bar. This rebalancing benefits two key dynamics.
- The rise of more premium offerings: 1 festival in 5 has expanded its bar menu to include cocktails and spirits for the general public (outside VIP areas). As a result, the category is gaining traction: 2 out of 10 ffestival-goers now consume cocktails or spirits (+3 pts), while average spend per buyer in this category has increased by 10%.
- A moderation trend driven by the growth of alcohol-free options (water and soft drinks). 2 out of 10 festival-goers purchase water (+4.6 pts), and 4 out of 10 buy soft drinks (+2.5 pts). These beverages also show an increase in average spend per buyer (+11% and +8% respectively).
Overall, orders for cocktails (13%, +1pts), water (7%, +1.8 pts) and soft drinks (18%, +0.9 pts) are all increasing. The result is a more eclectic bar offering, even if external factors, weather in particular, continue to influence consumption choices.
3. Beer in focus: stable volumes, rising value
Beer remains at the heart of the bar, with an offering and format that continues to evolve.
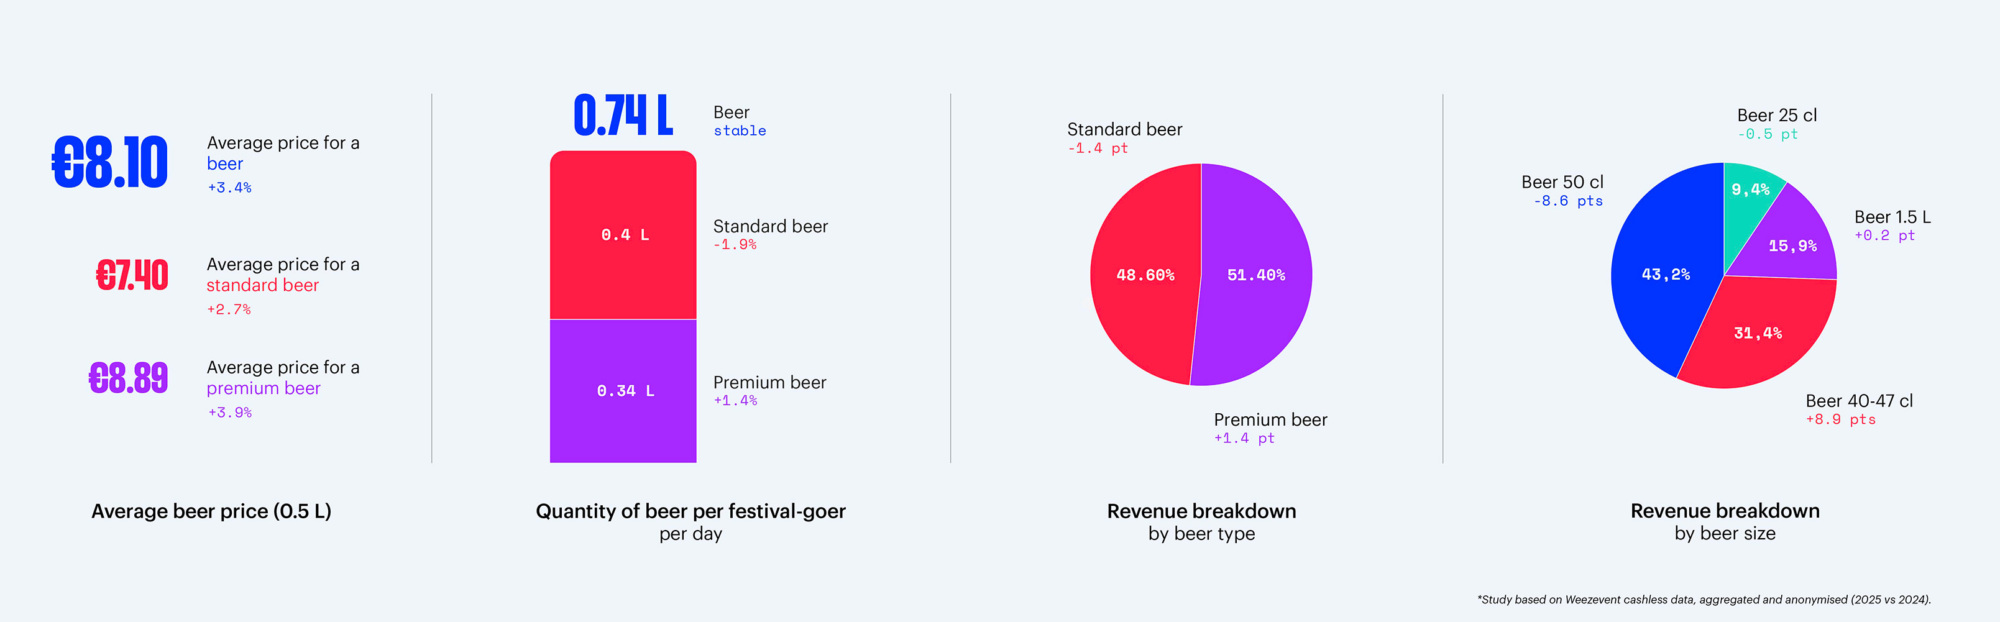
In 2025, the 40–47 cl format saw strong growth. Now offered by 4 out of 10 festivals (vs 2 out of 10 in 2024), it accounts for 31.4% of beer revenue (+8.9 pts). The 50 cl format remains dominant, but declines to 43.2% (-8.6 pts), while the 25 cl format slips to 9.4% (-0.5 pts); the 1.5 L format remains stable at 15.9% (+0.2 pts).
Price increases remain moderate (+3.4%, or €16.2 per litre), largely driven by the growth of the 40–47 cl segment, which delivers higher value per litre (€22/L, compared with €13.5/L for 50 cl and €15.4/L for 25 cl).
In terms of spend, value continues to rise, reaching €38.33 per buyer (+3.3%). Average spend per festival-goer per day follows the same trend at €11.97 (+3.3%).
Meanwhile, consumption volumes remain stable (0.74 L per festival-goer per day, 2.40 L per buyer over the course of the festival), indicating that growth is primarily driven by a more premium product mix rather than increased consumption.
Looking more closely, standard beer* consumption has seen a slight decline (-1.9%, to 0.40 L per festival-goer per day), while premium beer* consumption has increased (+1.4%, to 0.34 L per festival-goer per day). Premium beer continues to gain ground in sales, now accounting for 51.4% of beer revenue (+1.5 pts) and 47.5% of volume consumed (+1 pts). Its average price is also rising faster than that of standard beer (+3.9% vs +2.7%), further strengthening its contribution to overall bar value.
4. Food & merch: moderate growth, contrasting profiles
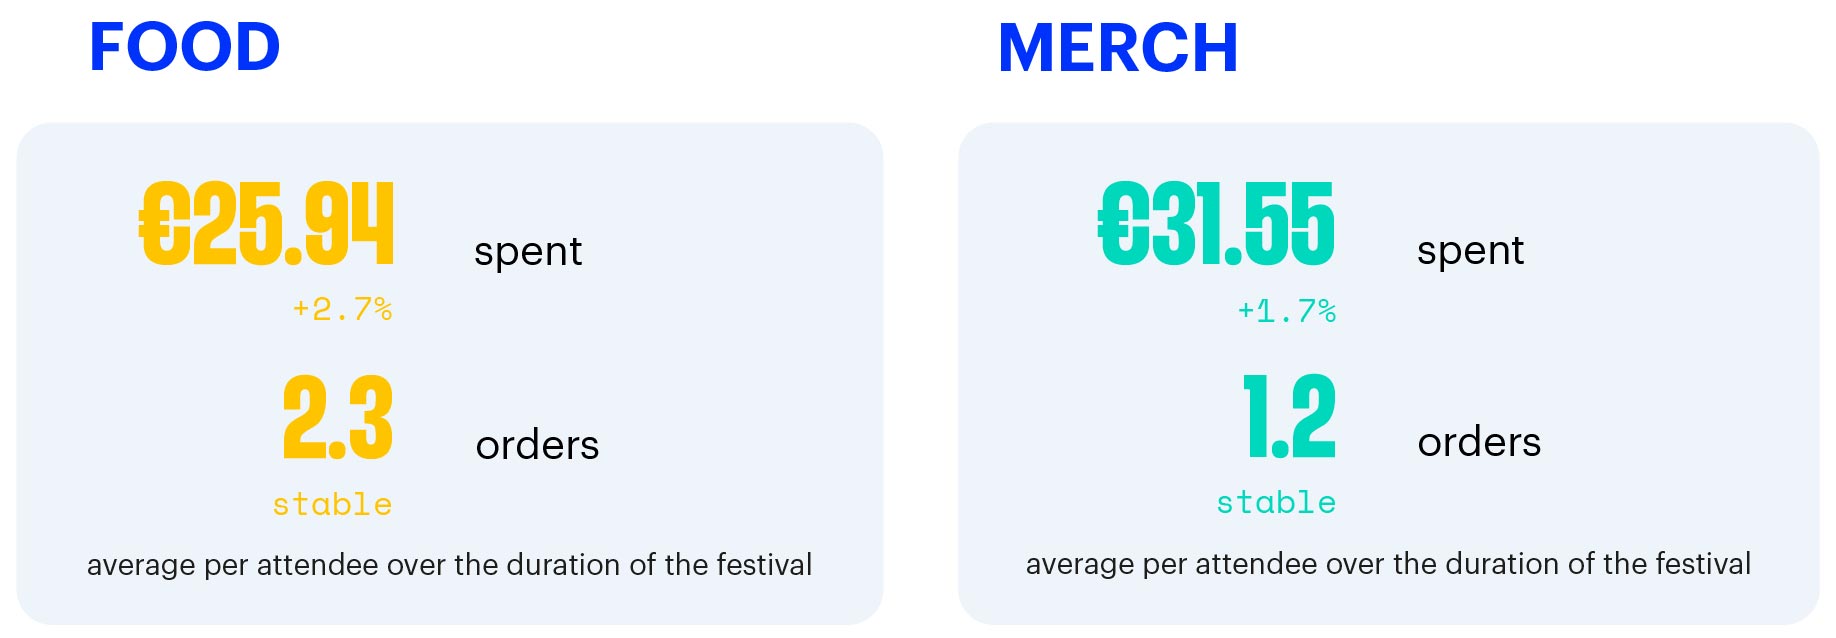
When it comes to food & beverages, an attendee spends an average of €25.94 over the course of the festival (+2.7%), representing an average daily spend of €8.67 per attendee (+4.5%).
Penetration increases slightly (7 out of 10 festival-goers, +2 pts), while purchase frequency remains stable, with an average of 2.3 transactions per festival.
In short: slightly more buyers, just as often, and at a slightly higher spend.
Merchandising remains a marginal category, but shows measured growth. The average basket reaches €31.55 (+176%), with an average daily spend per attendee of €1.18 (+3.2%).
This gap is mainly explained by a low penetration rate, with fewer than 1 in 10 festival-goers purchasing merch during a festival (6.8%, stable).
Merch purchase frequency also remains stable, at around 1.2 purchases per buyer over the course of the event.
5. Size & location: how context shapes consumption
The festival environment plays a key role in consumption patterns.
While there is no major difference in average spend per attendee, the revenue mix varies significantly depending on the setting.
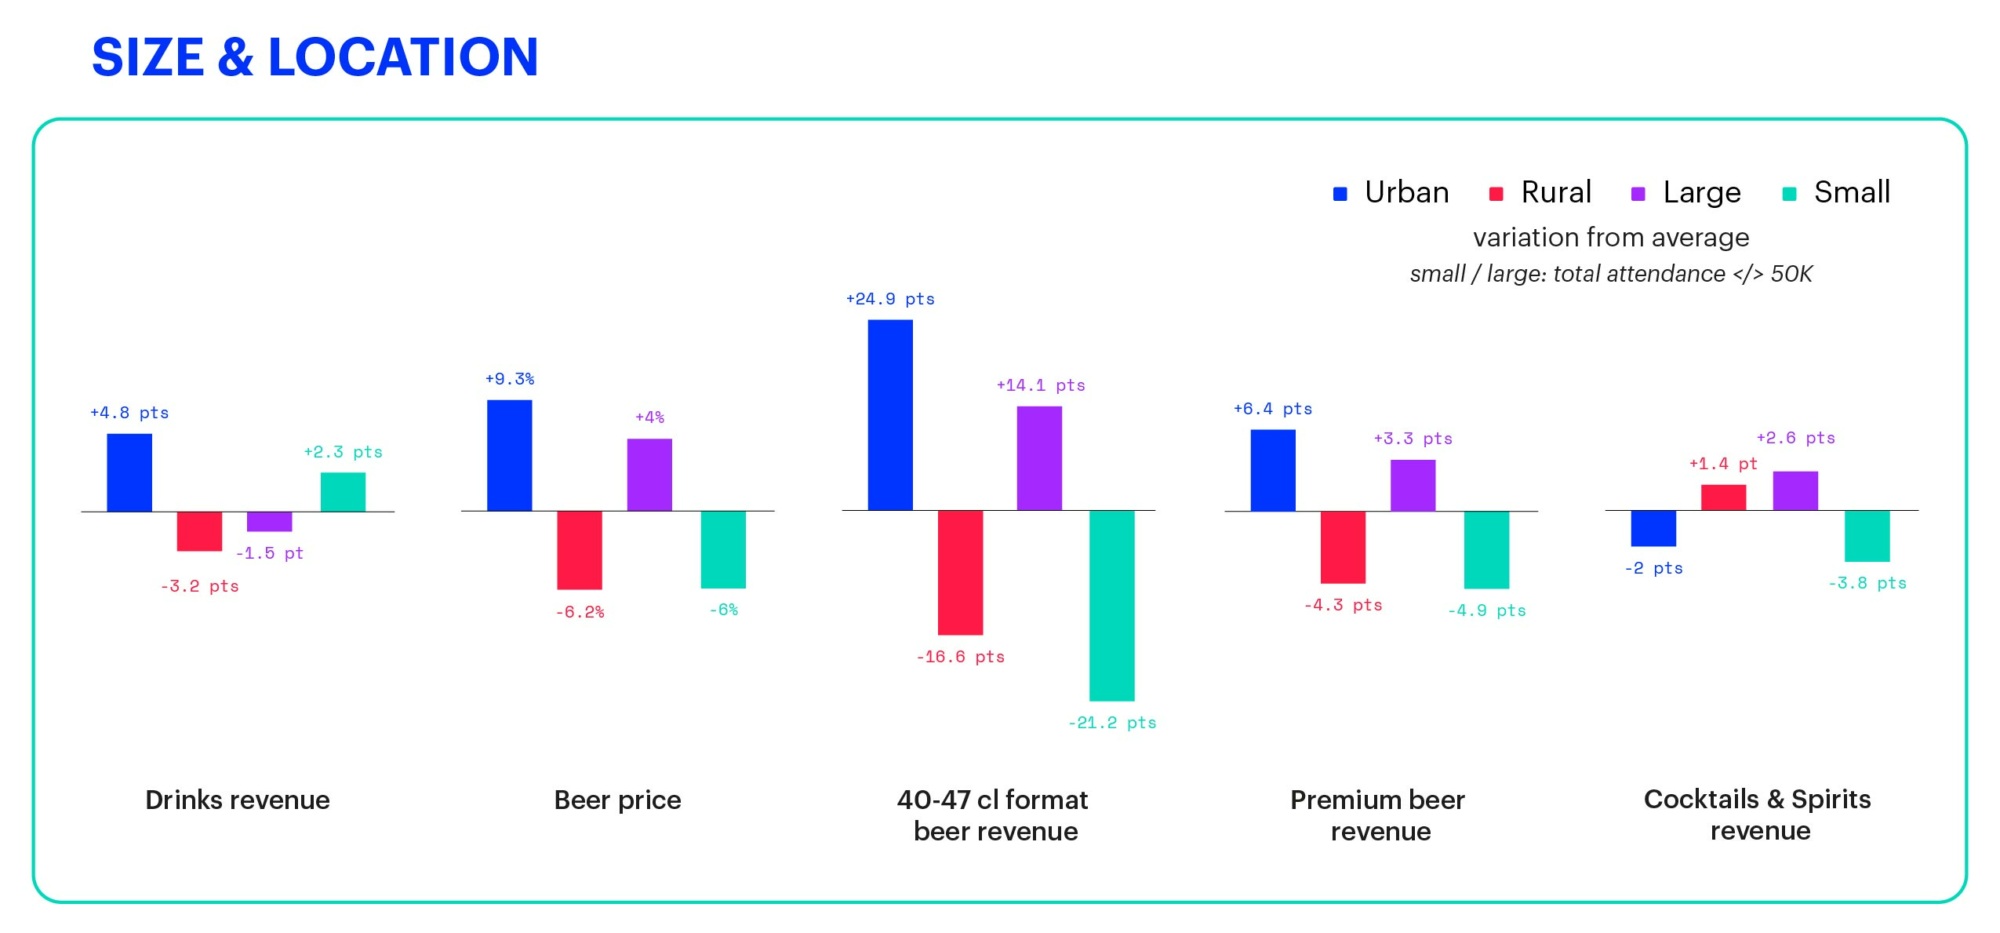
Urban festivals generate a larger share of their revenue from bars (+4.8 pts), while food weighs less (-3.4 pts), with a penetration rate 7 points lower. Conversely, at rural festivals, beverage revenue sees a slight decline (-3.2 pts), while food plays a bigger role (+2.3 pts), supported by a higher penetration rate (+4.7 pts).
At bars, beer remains the main driver of territorial differences. In urban settings, average prices are higher (+9.3%) and premium beer accounts for a larger share of revenue (+6.4 pts), with consumption volumes in line with the panel average. At rural festivals, the pattern is reversed: more accessible pricing (-6.2%), a lower share of premium beer revenue (-4.3 pts), and volumes also aligned with the average.
Beer formats further reflect these differences. Urban festivals generate more beer revenue from 40–47 cl formats (+24%), while rural festivals remain more attached to the 50 cl format (+14 pts).
Festival size is another key factor.
Average spend per festival-goer varies widely: -10.5% at small festivals versus +7% at large ones, compared with the panel average.
Small festivals record higher bar revenue shares (+2.3 pts), unlike large events (-1.5 pts), while food remains broadly stable across formats.
With bar sales, the mix also shifts. At small festivals, beer dominates (+3.9 pts of beverage revenue), while spirits and cocktails are under-represented (-3.8 pts). Large festivals show the opposite trend, with cocktails & spirits carrying more weight (+2.6 pts) at the expense of beer (-2.6 pts).
Beer formats vary accordingly. Small festivals over-index on 25 cl formats (+4.7 pts) and pitchers (+6.7 pts) in beer revenue. In contrast, large festivals concentrate beer revenue around 40–47 cl formats (+14.1 pts), where a higher price per litre naturally drives value.
Finally, premium beer is prevalent at large festivals (+3.3 pts of beer revenue), but not so much at smaller ones (-4.9 pts). This results in a slightly lower average price per litre at small festivals (-6%) and a higher one at large festivals (+4%).
6. Weezevent recommendations
Each season, we support more than 600 events and festivals with our cashless payment solutions. This on-the-ground perspective allows us to identify what truly enhances the experience, and to pinpoint the levers that make a real difference.
The insights below do not comment on the data itself, but extend it. They translate this season’s observations into practical, operational reflexes, to be adapted according to the size, setup and audience of each festival.
Acting on value and volume
The key question is simple: how can organisers increase spend per festival-goer and ultimately grow their F&B revenues? 2 strategic levers clearly emerge: the value of each individual purchase, and the overall volume of transactions.
Increasing purchase value
Diversifying the offer for a more discerning audience
Festival-goers’ F&B expectations are evolving; more curiosity, higher standards. In this context, cocktails and spirits have found their place, creating both value and margin, provided their impact on drinking speed is carefully managed, so as not to limit overall consumption.
At the same time, non-alcoholic options are becoming a market in their own right, driven by younger generations, summer heat and the search for new experiences. Offering more than a standard soft drink is now a lever for differentiation as much as revenue generation.
Adjusting prices to match audience purchasing power
Pricing is never absolute. It depends on audience demographics, purchasing power, location and the festival’s positioning. Rethinking prices is a strategic decision that should be based on the reality of the audience and the experience delivered, rather than on fixed benchmarks.
Monetising the experience
There is no single festival-goer profile. Audiences differ, as do expectations and spending levels. Embracing this diversity unlocks additional value opportunities. VIP areas are the most striking example; moving from a standardised open bar to a genuinely premium experience can significantly increase revenue per person. This may involve a curated premium selection, higher pricing, table service or shared bottles that naturally raise the average basket. Some festivals even offer multiple VIP tiers, a clear sign that there is still untapped potential to explore.
Rethinking formats to increase value per transaction
The 40 cl format reshapes the economics of a drink: lower volume, similar pricing, higher margins. Conversely, shared formats, pitchers and carafes, increase spend per transaction while improving bar flow. Fewer visits, higher-value orders: a balance that works both logistically and financially.
Trading up in line with the overall experience
Moving upmarket is a genuine audience expectation. Premium beers, local breweries, more refined cocktails; the F&B offering is evolving in step with the stage design, sound and scenography. Festival-goers willing to invest more in their ticket also expect a coherent F&B experience and they are ready to pay for it.
Growing consumption volumes
If increasing value is one part of the equation, pace is the other. Growth then becomes an operational challenge, speeding up service, handling rush periods, reducing waiting times and avoiding lost sales caused by a lack of flow.
Speeding up service
Increasing service throughput is one of the most direct ways to boost sales. Bar efficiency starts with the right staffing and equipment setup. A ratio of around 1 bartender per 200 people provides a solid baseline, with 2 metres of counter space per server to maintain a steady flow without congestion. On the supervision side, 1 manager for every 6 servers is a common balance, making it possible to adjust roles in real time and keep momentum during peak periods.
Internal processes must then be finely tuned. Smooth service often relies on 1 prep staff member for every 2 servers, preventing pouring, measuring or setup from becoming bottlenecks. Likewise, 1 beer tap for every 3 servers helps limit internal constraints; if beer can’t be poured quickly enough, the entire chain slows down.
Gains also come from how the purchase journey is structured. Organising clearly identified racks by product type and pre-preparing key items reduces the time spent on each order. Moving payment up the queue, directly into the waiting line, allows orders to be taken in advance and flows to be spread before reaching the counter. Production can then focus purely on service – faster, more consistent and more profitable.
Finally, the offer itself must support speed. A streamlined range, standardised formats and containers, and a menu that is easy to read from a distance all help reduce hesitation and back-and-forth, increasing the number of transactions per minute.
Multiplying points of contact
Fixed bars are not the only places where sales happen. To increase transaction volumes, organisers need to go to the audience rather than wait for them. This is where mobility comes into play through pop-up sales points, roaming service on foot or by bike, or by selling directly within the crowd instead of behind an already saturated counter.
This approach also requires operational agility. Temporarily deploying teams in high-traffic areas during peak moments helps absorb demand and prevent lost sales due to limited throughput.
Digital tools complete the picture. Click & collect via the cashless account creates new virtual points of sale – no queues, no physical setup, available at any time. The attendee orders, pays, and collects, turning the purchase into a fast, almost frictionless action.
Creating new moments of consumption
Increasing spend is also closely linked to time spent on site. The longer festival-goers stay, the more opportunities they have to consume. The challenge is therefore to create additional moments, before, between or after concerts, that naturally extend their presence.
This can take many forms, such as encouraging earlier arrivals, extending the evening, opening a limited-capacity after-area, or organising a food-related activation to generate a spike in attention and footfall. Each additional moment is a reason to stay, to experience more and ultimately, to consume more.
Extending monetisation beyond F&B
A share of growth also comes from everything that surrounds the festival experience.
Merchandising is the most accessible lever, but it becomes even more effective when it extends beyond the event itself, for example at the moment of cashless balance refunds, when user attention is at its highest and a final purchase can easily turn into a lasting souvenir.
Next are services and comfort, which become powerful value drivers when they address a genuine need. Shaded or misted areas allow organisers to monetise comfort during the hottest hours. E-lockers and power banks, which are easy to operate without creating additional queues, meet a constant demand. Even waiting time can be turned into an opportunity, e.g. raised platforms or time-slot viewing areas, which sell the view and transform frustration into a premium experience.
Mobility and accommodation also open up a wide range of opportunities. Priority parking or upgraded shuttle services primarily sell time, the scarcest resource at a festival. Ready-to-use camping options, from pre-pitched tents and sleep kits to late check-out, turn comfort into a product in its own right, rather than a simple add-on.
The challenge is to extend spending in order to enhance the experience. The more a festival addresses concrete needs, the more value it creates beyond F&B and this is often where the next margin lies.
7. Methodology
This analysis is based on Weezevent cashless transactions, aggregated and anonymised, collected from a panel of 25 French festivals of varying sizes and contexts. It compares the 2025 and 2024 seasons using a constant scope.
All on-site cashless purchases (wristband/card) are included: bars, food outlets, merchandising and any sales points connected to the system. Each transaction is linked to a buyer ID (with no personal data), enabling reliable behavioural indicators.
Excluded from the scope are non-cashless payments (cash or card), certain VIP or staff areas and any sales points not connected to the event’s cashless system. This may slightly understate some absolute figures for mixed-payment sites, however, year-on-year (YoY) variations remain relevant, as the methodology is identical for both 2024 and 2025.
(*) Units & definitions:
- Festival-goer/day: indicator representing total attendance, calculated by adding together the number of daily festival-goers over the duration of the event.
- Buyer: a person who has made at least one purchase in the category considered over the course of the event.
- Penetration: the share of buyers who have made at least one purchase in the category considered over the course of the event.
- Frequency: the average number of purchases per buyer in the category over the course of the event.
- Buyer basket: the average spend per buyer in the category over the course of the event.
- Festival-goer/day basket: the average spend in the category, calculated per festival-goer per day.
- Take rate (beverages): the share of beverage transactions containing at least one product from the category.
- Beer volumes: the average number of litres of beer consumed per buyer or per festival-goer/day.
- Beer formats: grouped by size families: 25 cl, 30–33 cl, 40–47 cl, 50 cl, >1 L.
- Beer types: split between standard (classic beers, lowest unit price) and premium (beers with a higher unit price).
Processing
- Taxonomy harmonisation: categories and formats have been standardised across sites to avoid labelling bias.
- Location & size classification: urban/rural and small/large groupings are based on operational site attributes (attendance, location), unchanged between 2024 and 2025.
- Currency & VAT: all amounts are expressed in euros, VAT included as configured for each event.
- Weighting: results are not weighted by attendance; each festival counts as one unit, regardless of its size or level of activity.
Limits of interpretation
The results reflect the panel analysed. Local conditions (weather, site layout, line-up, offering) influence consumption levels and may explain certain counter-examples. Absolute figures may vary when some sales take place outside the cashless system; however, trends (penetration, frequency, basket composition, format reallocation) remain robust, as they are measured using the same methodology across two seasons.
Why cashless provides a clearer picture
Unlike bank card payments, which offer no visibility into the purchase journey, cashless links every transaction to an anonymised buyer ID. This level of granularity makes it possible to track purchasing behaviour by area and time slot, from penetration → frequency → basket size, analyse take rates (water, beer, cocktails, etc.) and compare before/after results from concrete tests (menus, formats, queues, placement).
For organisers, it also opens the door to meaningful audience segmentation, enabling targeted offers both on site and through ticketing (pre-sales, bundles, perks). In short, cashless doesn’t just measure revenue, it explains the behaviours behind it.
The 2025 season confirms a profound transformation in the economic model of French festivals. Faced with increasingly sophisticated demand and growing operational efficiency requirements, organisers are adapting their strategies by combining an upmarket shift in the offer (cocktails, premium beers) with the rise of non-alcoholic drinks to diversify revenue streams.
Now firmly at the heart of the event, cashless strengthens the precision of behavioural analysis, making it possible to identify new monetisation levers beyond F&B, particularly through comfort services or post-event merchandising.
Despite a more complex market environment, festivals demonstrate a remarkable ability to adapt, relying on data to optimise formats and enhance attendee satisfaction, regardless of their size or location.

