Once your event is over, it is very important to take stock before planning your next one. It can be difficult to know what to look for among all the data collected. At the end of your event, naturally you will seek the return on investment of all this organisation and the positive impacts of your choices and decisions. What are the data and indicators to track in order to know how to make a clear and solid assessment of your event?
Your goals will change depending on the type of event, and so will the choice of indicators to analyse and interpret.
Summary
1. Sales & revenues
The first evaluation of your event
Quite simply, if you organised a paid event the first questions you will ask when you review will be: did you break even? Did you achieve your sales target? Has your income exceeded your expenses? Have you made a profit?
Analysis of your ticketing
The number of tickets sold per day, your sales numbers and whether your targets in terms of number of registrations or seats sold has been reached. Was the event sold-out beforehand or on the contrary did it all sell-out at the last minute or on site? Can you spot any significant sales periods during the year (holidays, summer season or, on the contrary, during the winter, …)?
The seasonality of your sales is important in order to give you insights into the purchasing behaviour of your audience but also the actions — or lack of them — that may have affected sales. Reading the data allows you to make forecasts and anticipate for the following year.
The average basket
It is also interesting to have a look at your attendees’ average shopping basket, in relation to the number of tickets sold, the average basket is an indicator of purchasing behaviour: do they buy in a bulk? Single? Frequently — if your events are recurring — or throughout the event period — multiple sessions, days, editions? In this context, the tickets sold first or fastest are also an indicator — are they passes, promo offers or 1-day tickets?
Cross-referencing results
This data should be compared with your programming for example, or perhaps the weather played a part on the decisions of the attendees, is accommodation too few and far between in the area to allow people to stay longer than a day, etc.
For example, if your attendees’ purchasing behaviour tends toward bulk purchases but sales were late, why not offer group prices earlier in the year, organise entertainment or public transport to facilitate their arrival and/or improve their experience.
Analysing your revenues on site
And what about revenues on site? If you have a cashless payment system on site, you can track cashless sales and have an overview of the real-time revenue, giving you the opportunity to react and adjust, modulate certain aspects of the event.
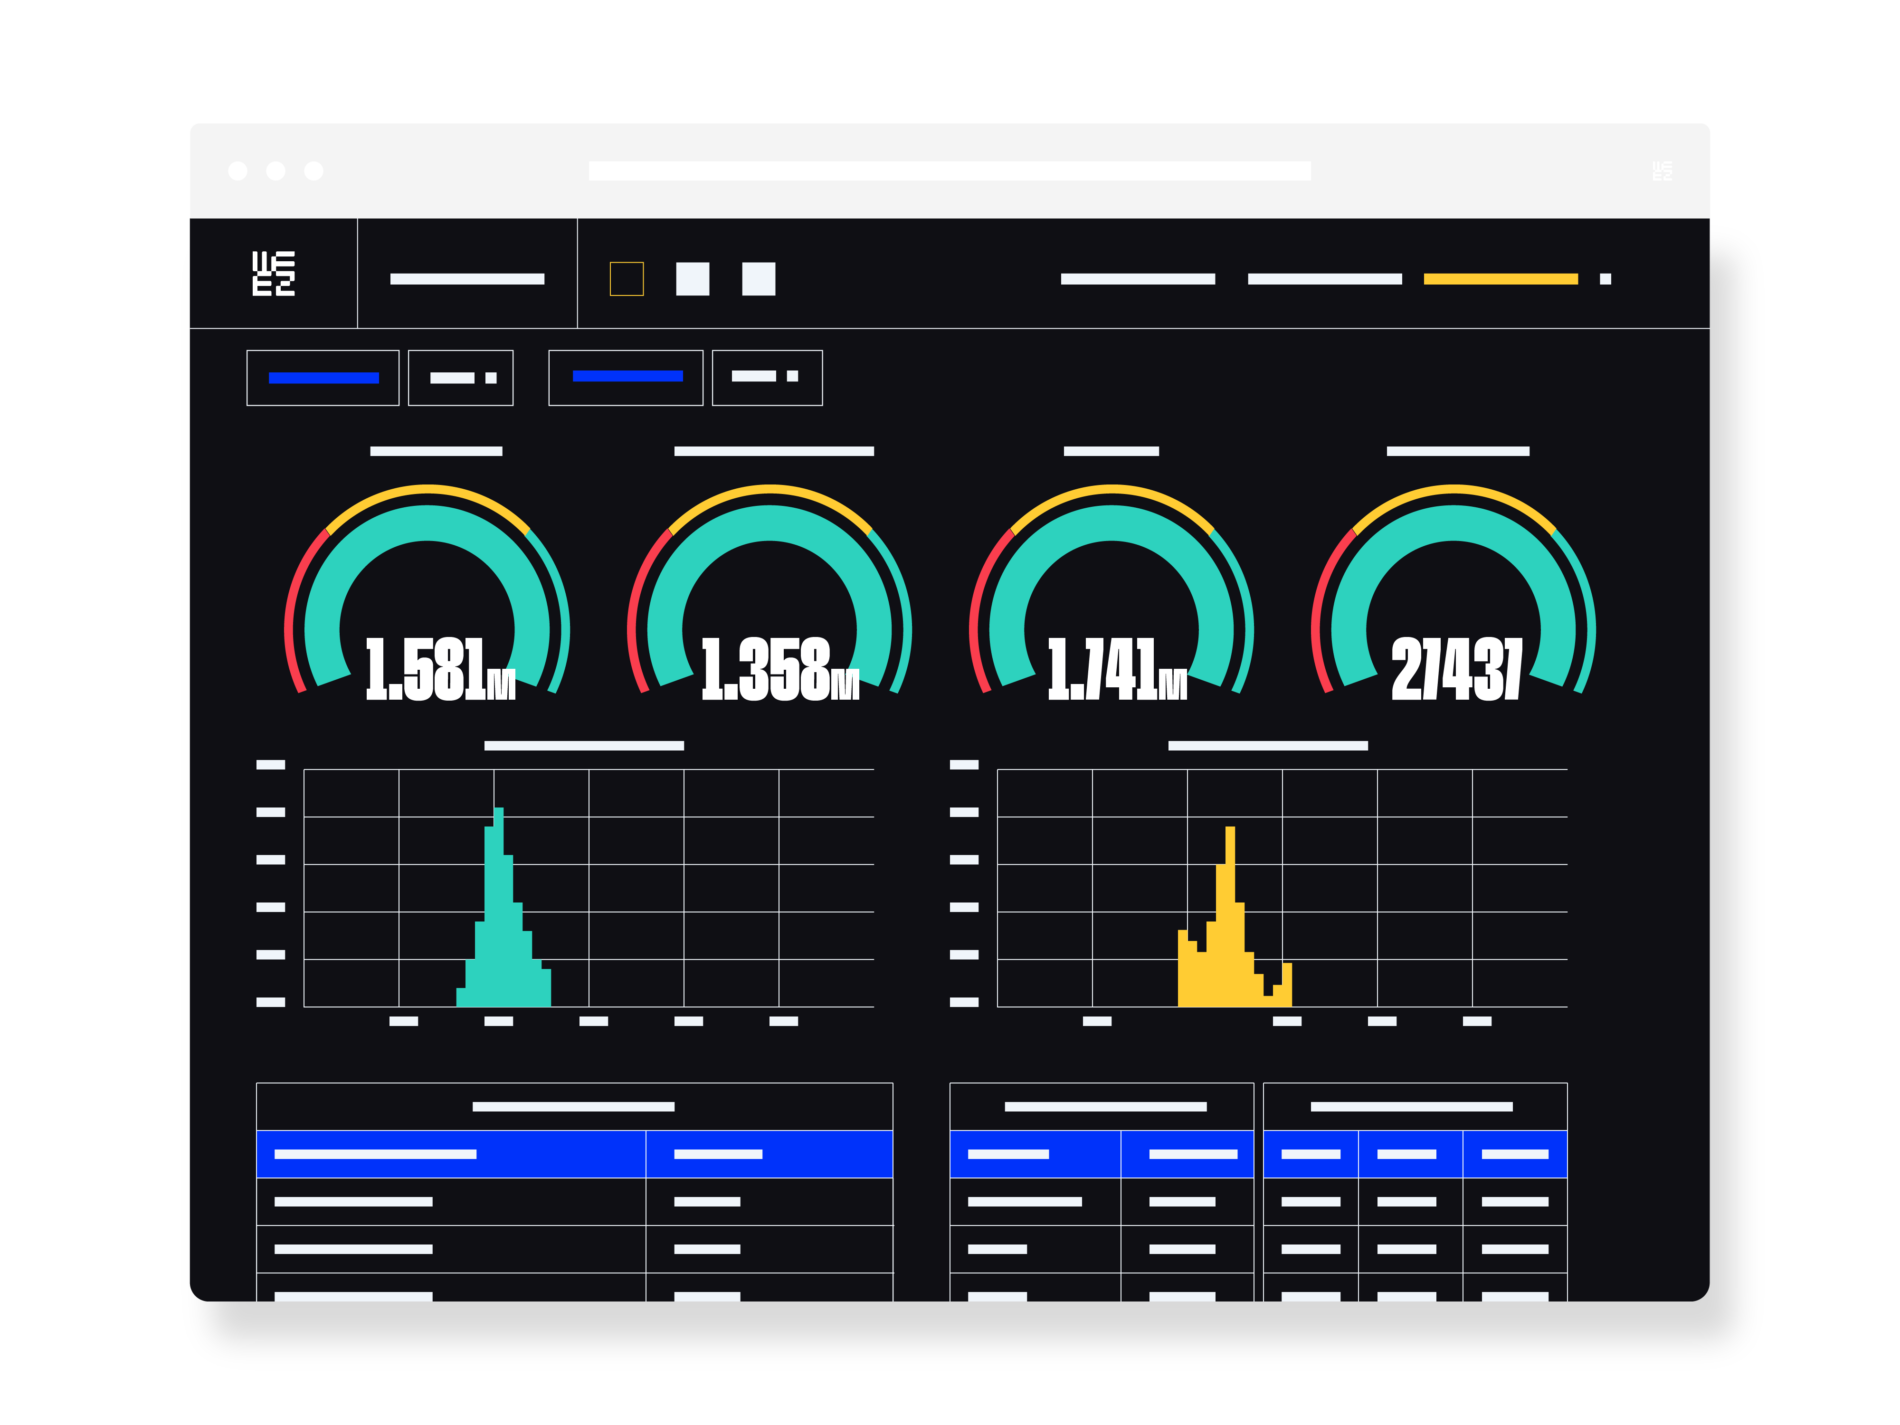
2. Website tracking data
These indicators are critical to gain a better understanding of your buyers and attendees: socio-demographic data, origin — do they come from social media or rather your advertising purchases and media partnerships? Blog posts and SEO?
Tracking visits to your website is a great way to understand the behaviour of your buyers but also of those who did not make a purchase: Where did they stop and why? Browsing may have seemed difficult or information they were looking for may be missing. These are indicators to track from the beginning — you can make improvements before your event by making small changes to the website or by communicating about the issues flagged!
3. Indicators for your communication campaigns
Related to your website tracking, it makes sense to track the fallout of your online and offline communication campaigns. It is easier to do this online as you can track your pages, posts, articles and ads stats and see at what time your audience is connected and most attentive to your message (using engagement as a proxy, i.e. clicks, comments, shares).
Throughout your communication campaigns, you will be able to see the impact they have on visits to your website for example, or on your sales. The impact of print campaigns in terms of visibility or exposure will be observed using the above-mentioned indicators.
In terms of media, doing a press review will give you an overview of the media impact once the event is over: articles mentioning you, interviews given, contacts made after sending press releases or communication time.
4. Attendance rate
Firstly, compare the first indicator — i.e. sales and revenue — to the number of people actually present at your event. Access control at the door allows you to track your event’s fill in real time, peak hours, number of participants and the type of attendee — based on their ticket. Turnout is a key piece of information to measure the success of your event.
This information will also help you identify possible improvements related to the management of your audience. Should you organise a staggered arrival of attendees for smoother access? Do the proposed schedules really correspond to the times when attendees are actually present? Do you need to get volunteers to welcome your audience?
5. Feedback
At the end of the event, do not hesitate to ask your attendees and your teams for feedback. Using an e-mailing campaign, you can send a form to collect their views. Remember to do it as soon as the event has ended, participants will answer and take the time to fill out the form while this is fresh in their minds.
It is important to carefully consider the questions — only ask questions/opinions for which you have a real need for data and feedback. Ask about the different parts of the event: reception, catering, solution, journey and user-experience. Do not forget the open-ended comments to give them an opportunity to speak their minds. The form must remain short and simple — drop-down menu, multiple choice, scale or rating — to encourage attendees to respond and to avoid creating a barrier that will cause them to give up before the end.
All this information will enable you to draw conclusions for your next event and its sales and communication strategy. The good times to communicate, which messages to convey and any potential promotional campaigns.
Take time to analyse, compare with previous years and other events. Your teams’ and service providers’ feedback is just as important — were there any unforeseen events that could have an impact on attendees’ feedback and on their experience?
Pay attention to both negative and positive feedback! They both contain valuable information that will help you to improve future editions of your event.
You already know the key points to take stock of your event.
Find out more tips:
- Why and how can you collect feedback from your attendees?
- Writing the perfect thank you email after your event
- 5 ideas for retaining your attendees after an event
Ready to plan your next event? Start now with Weezevent:

