Drawing on its support for major European events throughout 2022, Weezevent offers an analysis of trends in consumption and audience types at festivals. Aimed at event organisers, the results are based on data collected in 7 countries by the WeezTicket, WeezAccess and WeezPay solutions, and answer 7 key questions.
Summary
1. What is the average price of a day ticket?
The price of the typical* day ticket was €59 in 2022, an increase of 8% from the average price recorded in 2018.
The minimum price recorded was €39, while the maximum price recorded was almost double the average price at €109.
Similar to the rate of consumer price inflation in France over the same period, the increase in average ticket price is not uniquely high. We advise organisers to maintain current prices, while taking inflation into account.
*The average price of a day ticket is calculated on the basis of a standard day ticket for a Saturday, excluding promotions.
2. How has the average festivalgoer’s basket changed?
The average basket per day was €28 in 2022, an increase of 29% from 2018.
In addition to calculating the minimum (€13) and maximum (€55), we have added a distinction between urban festivals (+10%) and rural festivals (-3%) as well as between small festivals* (-20%) and large festivals* (+10%) to account for these disparities.
The data collected on the types of attendees (more and more VIPs) and the offering of more upmarket products – which we present to you in point 6 – seem to explain these differences in the average basket.
*In this study, the boundary between ‘small festival’ and ‘large festival’ is 15,000 festivalgoers per day.
3. How much does a festivalgoer spend on site compared to the cost of the ticket?
Typically, in 2022, the average basket was 47% of the ticket price. With a growth of 8 points from 2018, the increase in the average basket is higher than the increase in the ticket price.
This analysis means that for a €100 ticket, the average festivalgoer spent €47 on site.
The average basket in relation to the cost of the ticket ranged from a minimum of 23% to a maximum of 62%.
This data is valuable and can be used to calculate your estimated revenue, particularly in the case of a first edition. It can also be used as an indicator to draw up a portrait of your attendees: compared to the average, are your visitors extravagant or cautious with their money? You can use the answer to adjust your on-site offering.
If we combine the festivalgoers’ average basket with the ticket price, we can see that the average revenue generated per day by a festivalgoer in 2022 was €87, an amount that has increased by 14% since 2018.
4. How is turnover distributed throughout the event?
Since 2018, the share of turnover generated by Bars has decreased in favour of Catering and Merchandising.
Below is the breakdown of turnover during the event (excluding ticketing):
- Bar: 59% (-5pts from 2018)
- Catering: 30% (+3pts from 2018)
- Merchandising: 5% (+2pts from 2018)
- Other: 6% (similar to 2018)
Given that catering is an increasingly important part of festival turnover, it would be unwise to miss out on this opportunity and not develop your food offering further.
As mentioned in our last article on the digitisation of cashless, click & collect could be the next step in your strategy to reduce waiting times at food outlets, and increase your sales.
Merchandising has nearly doubled its share and is enjoying the biggest increase.
Although it represents only 5% of the turnover generated during events, merchandising is the fastest growing expense item. We therefore recommend that you continue to offer your attendees accessories, clothes, bags and other goodies bearing your festival’s image.
5. What is the proportion of partners and VIPs in relation to the total audience, and what do they buy on site?
The proportion of VIPs in relation to all festivalgoers has almost doubled since 2018.
In 2022, the average share of the VIP audience was 5% of the overall festival population (min: 0%, max: 11%). This echoes the recommendation we made in our New Year’s advice article: you have everything to gain from implementing premium segmentation for your events. Many people are willing to pay for extra comfort and access to services previously reserved for partners and major sponsors.
The average basket in the VIP area was 89% higher than the average basket for the total audience.
With an average basket of €53, VIPs spend far more on site than other attendees.
To increase your event’s revenue, as well as developing your catering offering, think about creating zones and optimising the management of the welcome offered to VIPs.
6. What are the average prices at bars?
To get an idea of the average prices recorded, we collected data on three benchmark items: classic beer, speciality beer (price and volume sold) and soft drinks.
Here are the average prices in the other European countries participating in the barometer:
- Spain | Classic: €5.25 / Speciality: €6.50
- Germany/Austria | Classic: €5.80 / Speciality: €6.80
- Switzerland | Classic: €6.15** / Speciality: €7.60
- Belgium | Classic: €6.80 / Speciality: €8
- United Kingdom | Classic: €7.40** / Speciality: €9.70
*Prices adjusted to a pint where the capacity is 0.33cl.
** Currencies converted to € at the exchange rate applicable on 01/08/2022.
The share of speciality beer* in relation to total beer consumption increased by 5 points from 2018, while total consumption remained unchanged.
Although the average volume of beer consumed per festivalgoer has remained stable at 0.9L since 2018, the type is changing. In 2018, 59.5% of the beer consumed was classic, but in 2022 this share dropped to 54.5%.
This data breaks the preconceived notion that the majority of festivalgoers consume the ‘cheapest’ beer, and proves the need to work on the depth of your beer offering by building on the variations that exist today. This is expected by audiences, as well as providing an additional opportunity to boost your revenue.
*Speciality beer refers to premium beer (ALE, IPA, etc.).
The average price of soft drinks in France was €3.20 in 2022, the lowest in Europe.
The price of soft drinks also increased in proportion to inflation. It should be noted, however, that in urban areas, this average price can increase by almost 30%, and in Germany has reached €4.80.
7. How can we take advantage of different audiences’ consumption habits?
These figures, coupled with those in our article on the digitisation of cashless, allow us to draw three main findings:
- The demand for high-end experiences is increasing
- The demand for catering is increasing more than for bars
- Audiences are demanding a more advanced digital experience
To meet these demands and offer an experience that meets your audience’s expectations, you’ll need to adapt your offering and continue to develop experiences that will enrich it (e.g. a mobile app, click and collect, premium drinks offer, VIP pack, etc.).
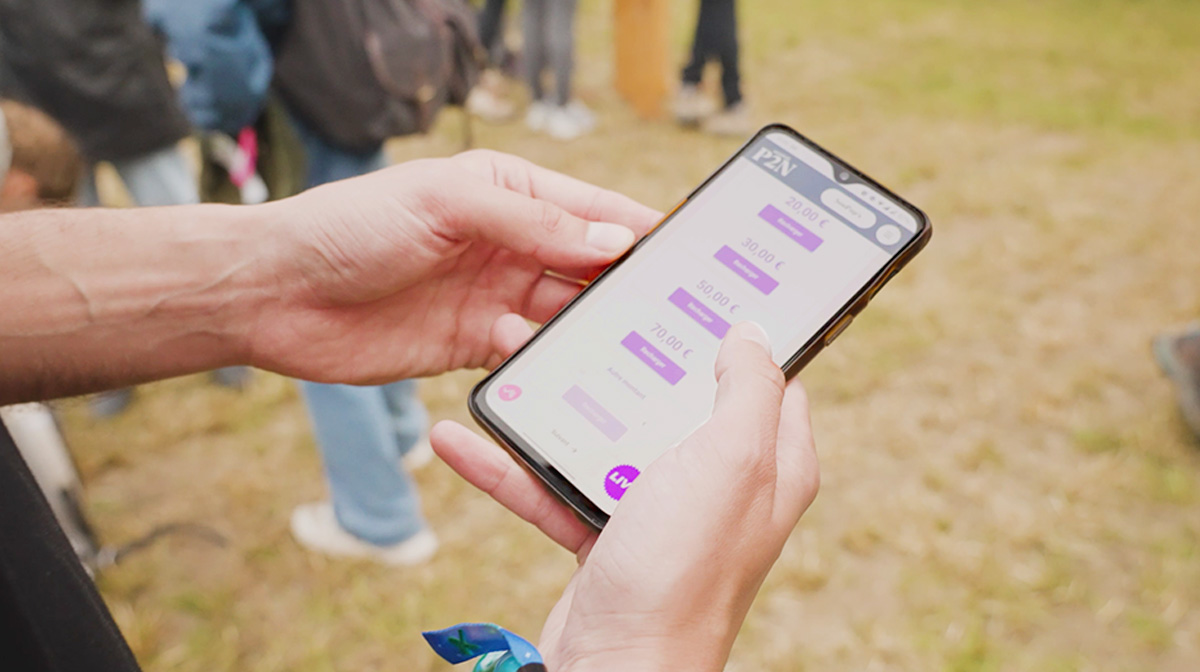
We recommend that you use whatever means are at your disposal to continue collecting and analysing your data in depth. For instance, you can explore in detail the data collected on your Weezevent account through the ticketing, access control, cashless and mailing tools at your disposal.
Want advice on collecting and using your attendee data? Contact our team of experts!